I wonder how these stats would change if there weren’t cars on the road. I mean its pretty obvious if a car and a motorcycle crash the motorcycle’s gonna have it worst.
this post was submitted on 28 Nov 2025
380 points (95.7% liked)
Data is Beautiful
7049 readers
13 users here now
A place to share and discuss visual representations of data: Graphs, charts, maps, etc.
DataIsBeautiful is for visualizations that effectively convey information. Aesthetics are an important part of information visualization, but pretty pictures are not the sole aim of this subreddit.
A place to share and discuss visual representations of data: Graphs, charts, maps, etc.
  A post must be (or contain) a qualifying data visualization.

  Directly link to the original source article of the visualization
    Original source article doesn't mean the original source image. Link to the full page of the source article as a link-type submission.
    If you made the visualization yourself, tag it as [OC]

  [OC] posts must state the data source(s) and tool(s) used in the first top-level comment on their submission.

  DO NOT claim "[OC]" for diagrams that are not yours.

  All diagrams must have at least one computer generated element.

  No reposts of popular posts within 1 month.

  Post titles must describe the data plainly without using sensationalized headlines. Clickbait posts will be removed.

  Posts involving American Politics, or contentious topics in American media, are permissible only on Thursdays (ET).

  Posts involving Personal Data are permissible only on Mondays (ET).
Please read through our FAQ if you are new to posting on DataIsBeautiful. Commenting Rules
Don't be intentionally rude, ever.

Comments should be constructive and related to the visual presented. Special attention is given to root-level comments.

Short comments and low effort replies are automatically removed.

Hate Speech and dogwhistling are not tolerated and will result in an immediate ban.

Personal attacks and rabble-rousing will be removed.

Moderators reserve discretion when issuing bans for inappropriate comments. Bans are also subject to you forfeiting all of your comments in this community.
Originally r/DataisBeautiful
founded 2 years ago
MODERATORS
motorcycle vs. motorcycle is gonna be like medieval jousting
Didn't you know? This is what me and my buddies get up to on Saturday nights.
Motorcycle cops think they're hot shit because they can weave between a bunch of cones. Amateurs. Lets see you try to work the throttle, brake, and clutch on a dirtbike while also wielding a 10' long piece of PVC pipe with a boxing glove on the end of it.
load more comments
(1 replies)
load more comments
(4 replies)
Not saying bikes aren't the most dangerous, but comparing against the distance skews this. A plane trip is usually quite a bit longer than any other.
Not sure how else to measure it though, maybe against number of trips traveled?
Number of trips sounds more reasonable. It will show the odds of completing a trip for different means of transport
Hours of travel time would likely be a good fit too.
hours doesn’t come as close to the metric that you’d like though
the purpose of travel is to get from point a to point b, so you want to measure the likelihood of death when travelling the comparable trips
hours doesn’t really work because different modes of transport complete the trip in very different times. distance however is relatively similar
load more comments
(4 replies)
Go go gadget spitball math!
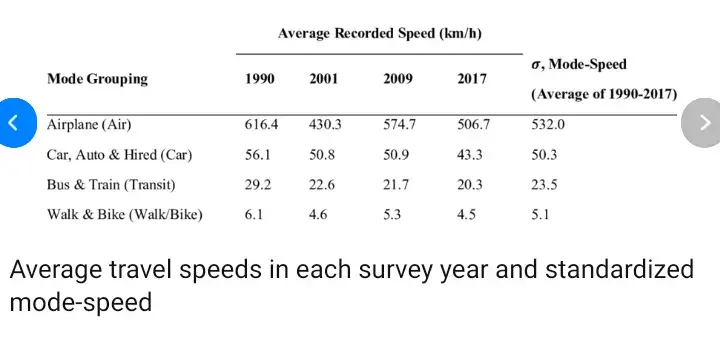
Sources for average transit mode speed
Source 1:
These are the average speeds of some common modes of transportation:
Commercial passenger aircraft: 547 to 575 miles per hour
Private jet: 400 to 711 miles per hour
Europe high-speed rail: 155 to 217 miles per hour
Shinkansen (Japanese bullet trains): 150 to 200 miles per hour
Modern cruise ship: 23 to 27 miles per hour
Bicycle: 10 to 24 miles per hour
Sailboat: 4.5 to 7 miles per hour
Walking: 3 miles per hour
Source 2:
Source 3:
https://wonderlearning.blog/real-average-speed-us-train-facts
When people think of passenger trains, they often envision swift, efficient travel. However, the operational reality for Amtrak, the primary passenger rail operator in the United States, is far more nuanced. While its locomotives are capable of impressive speeds, the average journey speed for most passengers is surprisingly modest, often hovering between 50 and 60 miles per hour, with long-distance routes averaging even less.
Ok, I'm USAsian, gonna be US-centric, and I'm gonna make some spitball roundings for easier math:
Average Actual Travel Speed:
Motorcycle: 50 mph
Car: 50 mph
Ferry: 25 mph
Train: 50 mph (long/medium distance)
Bus: 25 mph
Subway/Lightrail: 25 mph
Aircraft: 550 mph
Attempt at Conveying Math Proof
So we have:
D = deaths per billion miles. S = speed in miles per hour.
If we first solve for and find the time taken to travel one billion miles at speed S, we would do:
T = 1,000,000,000 / S
(T is time in hours)
What we want is D / T
D / T = D / ( 1,000,000,000 / S)
->
D / T = (D * S) / 1,000,000,000
So, that's our rough conversion.
Using (D * S) / 1,000,000,000 , the OP graph becomes:
Deaths per hour of transit, by transit mode, for every billion miles travelled:
Motorcycles: 10,628.5
Car: 364
Ferry: 79.25
Train: 21.5
Subway/Lightrail: 6
Bus: 2.75
Aircraft: 38.5
So... thats basically deaths per billion hours spent using said transit mode.
Notes
You may have noticed that Aircraft are now more dangerous than Buses, Subways, med/long distance Trains, and are only ~2x safer than Ferries, not ~45x times safer, as they are with the OP metric.
One hour of Motorcycles transit, on the other hand, is now ~29x more deadly than an hour of car transit, ~276x more deadly than an hour of aircraft transit...
... as opposed to the OP metric, where a billion miles of motorcycle travel is again ~29x more deadly than a billion miles of car travel, but is ~3039x more deadly than a billion miles of aircraft travel.
tl;dr:
Basically, take travel speed into account, and aircraft become significantly more deadly per hour spent travelling in them, but the ratios between terrestrial and aquatic craft stay pretty similar, due to no one having yet proposed the ikranoplan as a mass transit solution.
(Historically minded readers may note the absence from these numbers of the 'revolutionary' hyperloop, as well as monorail, due to basically not fucking existing in real life.)
You may quibble about the actual average speeds of various transit modes as you please.
More Notes
Probably also worth noting that this is only deaths, not injuries, say, requiring hospitalization.
I imagine doing deaths + serious injuries would also change this graph significantly.
Also also, this doesn't take into account road rage that does not directly involve the vehicle, I don't think.
It does not include injuries or deaths on some form of public or mass transit where say, you get assaulted by another passenger, or something like that.
That could also tweak things, potentially, but I have no strong instinct about if it would really matter, or how... and, you could again do deaths vs deaths + serious injuries.
load more comments
(19 replies)
I feel like measuring this data based on miles is bad. This data would be much more relevant if it was measured in passenger travel hours instead.
A plane can travel like 500 miles in an hour. I feel that this skews the data significantly since its being compared to vehicles that should not typically be covering over 100 miles per hour.
I was thinking the same thing, but if the goal is to get from point a to point b then the real question is what gets you there the safest.
For example, if you wanted to know what the safest way to get from Los Angeles to San Francisco was or what the relative danger of each travel method was, this would be the right way to frame the data. The fact that it takes longer to travel with a car than a plane doesn't factor into the safety of the travel. You still go the same distance.
load more comments
(2 replies)
The only logical conclusion is the faster you go the safer you are.
I've tried to tell the cops this, and did you know it didn't work.
No dice on my argument that I'm trying to keep myself warm via air friction like the space shuttle, either.
load more comments
(1 replies)
What country? Why is bicycle missing?
America, because nobody else has nearly the fatality rate per mile. SEA has more fatalities per capita, but that's because they have 100x more bikes per capita.
The average american motorcyclist only rides as a hobby, they drive a car the rest of the time, and they're either driving a racing bike or a 900 lb Harley. This isn't a recipe for competent riding.
load more comments
(1 replies)
RIP my co worker and friend. It was 2001. You were the OG Bay Area techie. Empty pepsi cans and pizza delivery stacked sloppily on your desk. Smart AF and hard working, always laughing. Earning money loving living .
Riding your slim machine between lanes of SF traffic. Someone opened his car door for Lord knows what reason.
Your girlfriend was inconsolable at your funeral
load more comments
(13 replies)
so you're saying i should buy a motorbike? nice. On my way!
So according to this chart, any time I get in a car, I have a 1 in 137,362,637.36264 chance of dying?
That's a lot better than than I thought. I'll take those odds.
load more comments
(5 replies)
Well, nice knowing you all 😂
What percentage of plane deaths are snake related?
Nearly all of them.
Just fly on a weekend. It's typically worse on Monday to Friday planes.
I'd consider those driving motorcycles to be more prone to take risky maneuvers.
Wonder how the graph would change if they drove like regular commuters to the destinations (e.g. not weaving at traffic lights, not speeding for the thrill, no wheelies and other stunts).
I'd be interested to know if motor scooters/Vespas were lumped in with motorcycles. I'd wager a 99cc scooter has a lower mortality rate than a crotch rocket or a Harley.
load more comments
(2 replies)