Editing to let people know that I will be blocking anyone who feels the need to tell me why this graph is inaccurate. I truly don't care, but feel free to chime in with your useless take and land a spot on my block list! 🙂
A community to talk about the Fediverse and all it's related services using ActivityPub (Mastodon, Lemmy, KBin, etc).
If you wanted to get help with moderating your own community then head over to !moderators@lemmy.world!
Learn more at these websites: Join The Fediverse Wiki, Fediverse.info, Wikipedia Page, The Federation Info (Stats), FediDB (Stats), Sub Rehab (Reddit Migration)
Editing to let people know that I will be blocking anyone who feels the need to tell me why this graph is inaccurate. I truly don't care, but feel free to chime in with your useless take and land a spot on my block list! 🙂
For other nerds that absolutely hate dishonest and biased graphs, I present the normalized data. Wow. What a vertical line. 🤦♀️

I signed up, though I generally don’t like following individuals and much prefer groups or communities like Lemmy. Gotta support independent social media.
I found following hastags I'm interested in to work better for me.
This also works really well for Mastodon. Gets your feed going super easily.
this is probably the intended method to use mastodon, if you're trying to follow individual accounts you're just gonna suffer.
I also found actually taking time to find an instance that you vibe with (in my case, jorts.horse) really helps to keep stuff interesting in your Local timeline. As a bonus, it also furthers decentralization :)
Yeah I was on Fosstodon first. Moved to Sakurajima (Sharkey) and now I'm on Sakurajima (Mastodon).
You're right, the instance makes a big difference. Very important to find one you enjoy.
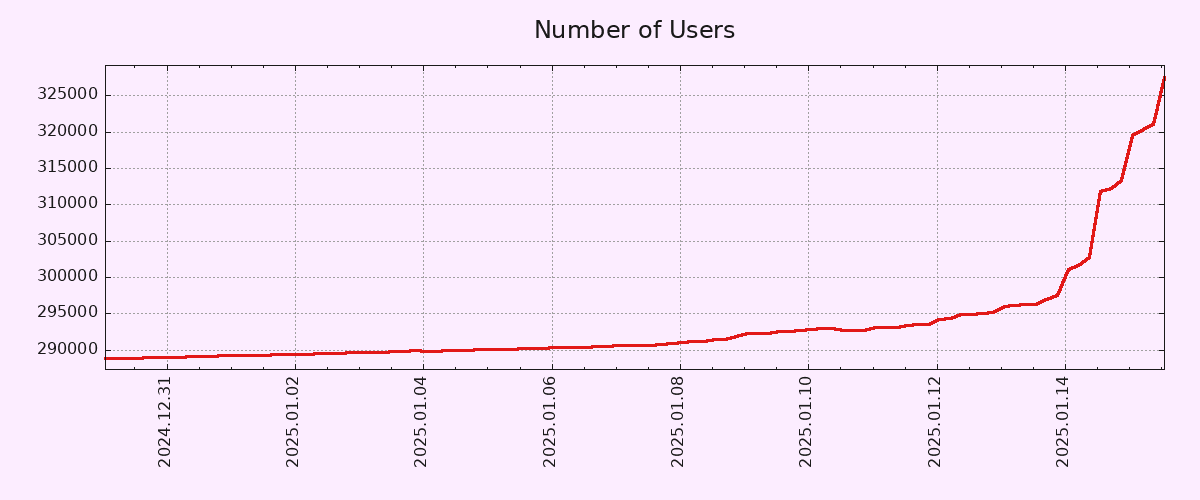
To be fair, the Y-Axis doesn't start from zero.
That being said, 10% account growth in 2 days is pretty solid. Let's hope both account creation and engagement metrics (MAUs/DAUs) keep growing.
EDIT: Correct Axis type.
Lies, damn lies, and graphs that don't have the Y-axis starting at 0.
10% growth in a day is nice, but far from a revolution. Let's see this trend going for a month.
The y axis starting zero does not change the fact that it's exponentially growing right now. Filter that link posted below for 120 days and it is still a nearly straight vertical line of growth.
It's not exponentially growing. At best, the growth rate has exponentially increased. These are VERY different things.
It was exponentially growing, the platform would come screeching to a halt and crash.
Jesus fucking Christ, you people are miserably pedantic. Nothing about my original post is wrong, so please kindly shut the fuck up with your "well achtually" takes.
Ah, the classic response to being proven wrong on the Internet. Have a hissy fit like a 5-year-old and call everyone pedantic etc. You were objectively wrong but there's no problem with that, everyone is wrong about stuff all the time, the difference is how you handle that. You either act like a mentally grown person and just go "oh, damn, I didn't know that, thanks for correcting me" or act like you've done. No one is out to say that pixelfed isn't growing, but you're misrepresenting facts and then being a fucking child about being told so.
Monthly active users increased by 43% between 13 and 14 January: https://pixelfed.fediverse.observer/dailystats
I don't think anyone here is arguing that the entire world will be using pixelfed by the end of the year, and that its usage will expand to other galaxies by the end of the decade.
It's a comment about the current growth curve, and it is both accurate and interesting.
Lemmy had the same jump in numbers during the Reddit Exodus. Mastodon had a huge boost when Elon bought Twitter.
Every spike has been a followed by a slide back to baseline in less than a couple of months. After you've seen it happen so many times, it is no longer interesting.
The fact that you believe these platforms were the same before and after these events makes it sound like you were not, in fact, there to see it happen. In my experience, it permanently changed both platforms, transforming them from weird niche sites to genuine alternatives.
That said, what you find interesting or not is not any of my business.
This thread (and others in that post) might interest you: https://communick.news/post/2320430/4138857
Yeah, I know I shouldn't bother. I am just annoyed by the misconception that all graphs should always start in 0 on the Y axis, as if it was some law of nature. Shouldn't allow myself to get dragged in further. :)
I am here since before the Reddit backout and I am on Mastodon since 2018. Lemmy was at 15k MAU, went up to over 125k and now is 1/3 of that. Mastodon had ~~1M~~ 575k something before Elon, hit up close to ~~2M~~ 1.5M and now is sitting around 800k. (edit: I was looking at the overall charts and used wrong figures. Corrected now.)
Sure, if your reference point is waaaay before the spikes then what we have now seem "a lot". However, my point is that these spikes are far from being indicative of mass adoption.
Lemmy was at 15k MAU, went up to over 125k and now is 1/3 of that.
So it increased by 200%
Oh, wow, very impressive! Did you have to use a calculator to get to this challenging result?
Communick's revenue grew 1800% in 2024, compared to 2023. Do you think that makes it successful in any way?
Successful or not, it isn't back to baseline
Again: "back to baseline" is not meant in absolute numbers, but trend-wise.
It's not "again" for anything you've written in this comment thread.
And you specifically suggested that these numbers can't be extrapolated, i.e. that they are not a trend. If it's indeed a trend for Lemmy to have 200% yoy growth then yeah, I'd think that'd be pretty successful.
It’s not “again” for anything you’ve written in this comment thread.
Try the sibling: https://communick.news/comment/4203442
If it’s indeed a trend for Lemmy to have 200% yoy growth then yeah, I’d think that’d be pretty successful.
You got it exactly backwards. There is a decline trend (monthly users go down month after after a spike) while the "200% growth" is not determined by any curve and can not be measured by any specific interval, because it was driven by one stochastic event that brought 100k people out of a sudden (the Reddit migration)
To go back to my original comment: let's see how the numbers are going to be in the next month. If the first derivative is still positive, then we can talk about "trends", until then we are just senseless cheering and extrapolating out of one data point.
The expression "back to baseline" comes from Science and Engineering and literally means that something has gone back to the previous ~~average~~ flat level (for example: "the power line noise level spiked when your turned the machine on but is now back to baseline")
Edit: not average, but actually specifically the original flat level below which things would not fall. Sorry, it's kinda hard to explain in words but very easy to point out in a graph or a scope were it's just this flat line to which things always return.
That expression makes sense if you're talking about the rate of growth itself (i.e. the Lemmy rate of growth spiked at the time of the Reddit changes and eventually went back to baseline, since Lemmy is not growing any faster now than before the Reddit changes) but it doesn't make sense if you're talking about user numbers since the number of Lemmy users grew a lot with the Reddit changes and never went back to the average before them, not even close.
Your original post is not clear on which of those things you're talking about when you wrote "back to baseline" and your subsequent posts are mainly talking about user numbers, giving the idea that that's what your "back to baseline" is refering to, in which case you're using that expression incorrectly.
Normalized graph for you:
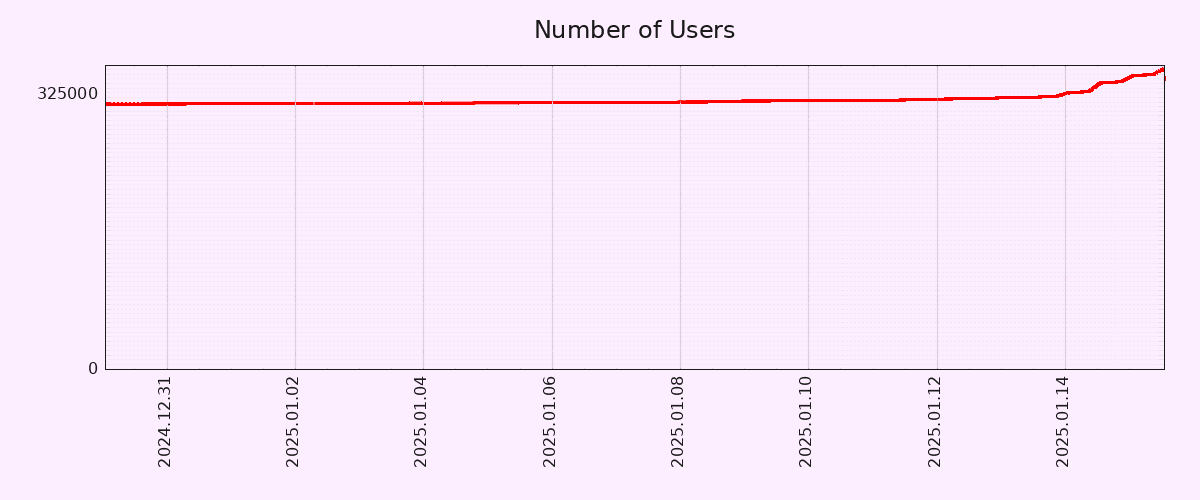
Not a vertical line, at all. For sure cool, but very exaggerated with a dishonest graph.
Just a FYI, Dan who made Pixelfed also does Loops and a few other Fedi projects in case people want more cool stuff to play with.